We like to start the conversation with sketches, wireframes and working on prototypes right of the bat on the computer. But, truth be told, there’s a lot of organizing and structuring information that happens before anyone can start drawing anything. And we could transform that information architecture process into a creative, collaborative and iterative practice, by learning the ways of the Post-It Note.
What we’ll do today is analyze a group of data we gathered in a previous client interview and try to organize it in a way that is logic and understandable to a site’s visitor.
[Nun] Chunks
First thing, first: separate information into smaller groups, or chunks so it’s easier to process. Our brains process information one piece at a time, so starting out with chunks will be a simple way to build up our diagram, grouping patterns together. For this exercise, each Post-It Note will be one chunk.
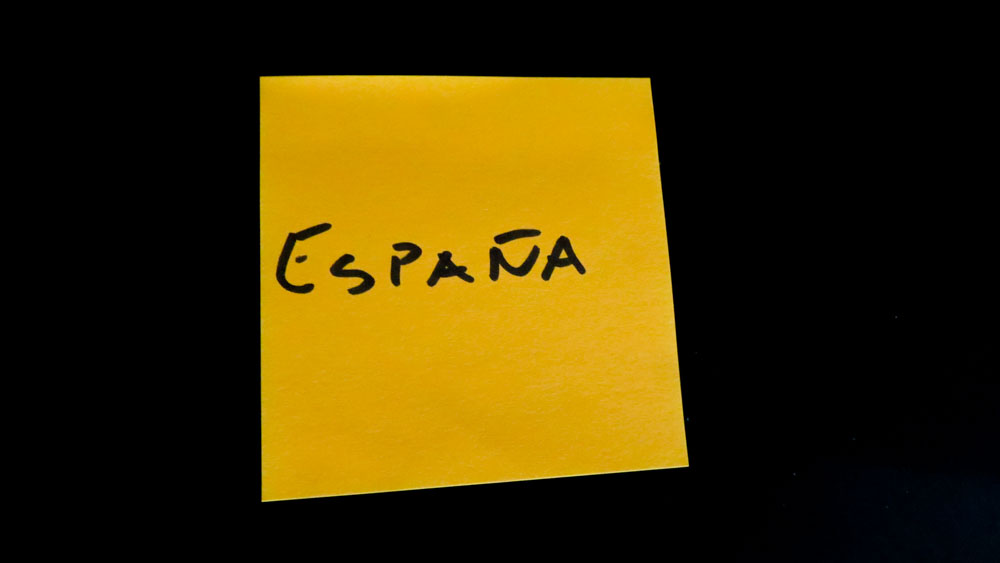
Each chunk of information could be any of these things: a fact, an opinion or a guess. We have evidence for the facts. People believe in their opinions about a subject; but that opinion might not be a fact, or it might be incorrect. And guesses are our best assumptions, considering the information we have at hand at the moment of our decision making.
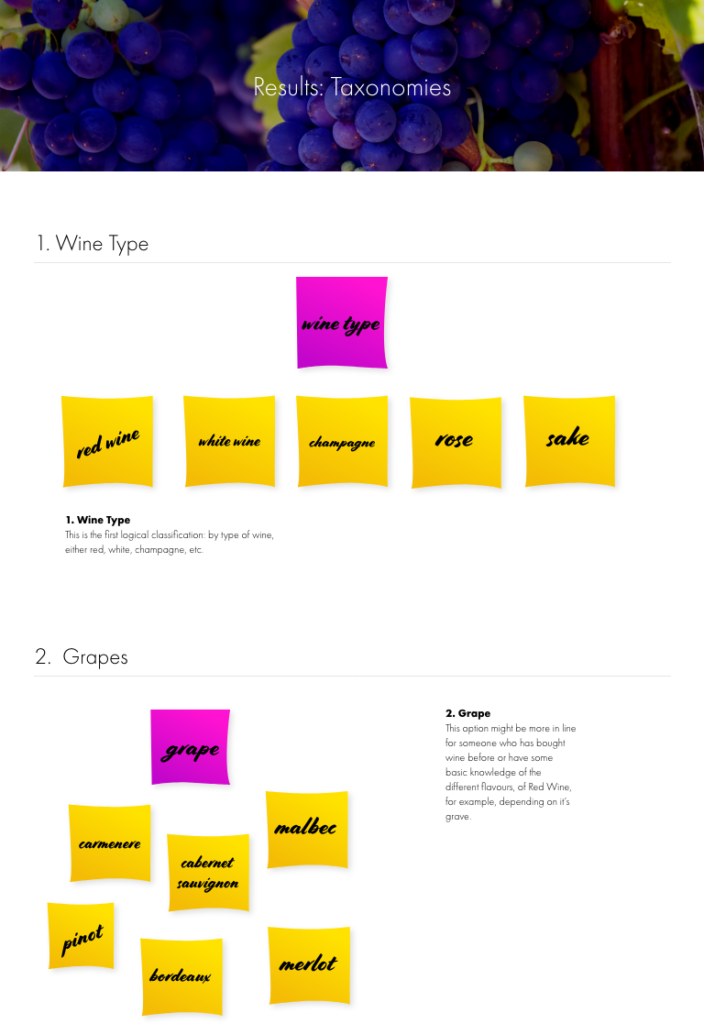
In this example, we are working with ways of organizing Wines. In our discovery phase (interviews, meetings, observation, benchmarks), we discovered a lot of labels that could describe each particular wine bottle, for example: Spain, Merlot, Red Wine, over $50.00, Abadía [brand name]. Our first step was to write all of these labels down…
Saturate that Wall with Information
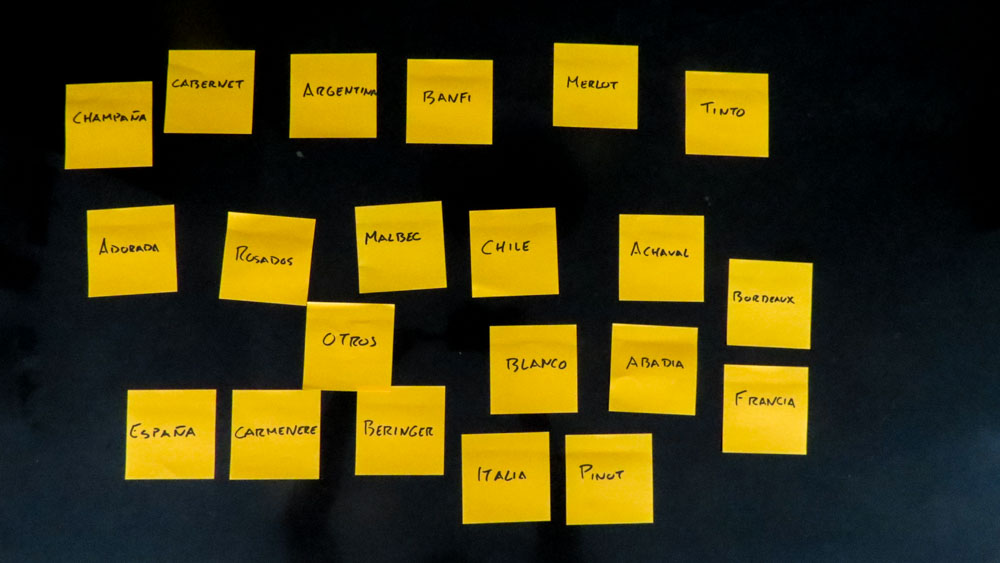
Now, we need to start sticking our information chunks into the whiteboard in individual Post-It Notes. This is exactly the same process as in the first step of Affinity Mapping, just collecting the most important insights and posting them on the wall without any order whatsoever. You “saturate” the wall with information.
This also resembles the “Capturing” phase of the GTD method, where you “download” everything you have to do, or everything you have in your head, into an unorganized list in paper.
Grouping
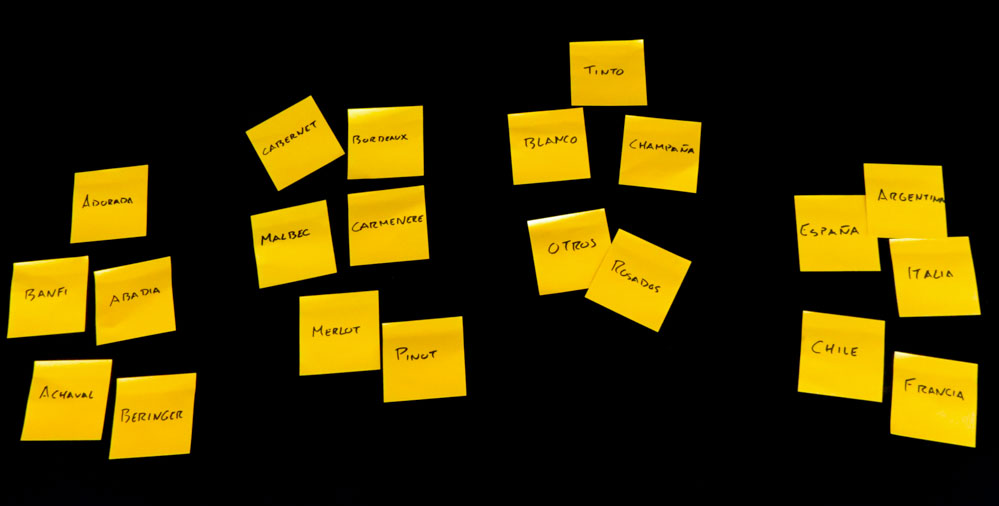
There’s a natural tendency to group similar information or chunks into smaller groups, so the next logical step will be for your to start grouping Post-Its into separate lists. You don’t need to have a very clear idea, name or label for each group, just a feeling that each share some sort of relation.
If you are problem solving, instead of site mapping, you could prioritize the ideas of each group, swapping the ones with higher priority to the top of the list and moving the least important to the bottom.
Types of Diagrams
Now that we have our information in one place, we can start organizing following one of these patterns:
- On a List
- On a Tree Structure
- Or in a Map
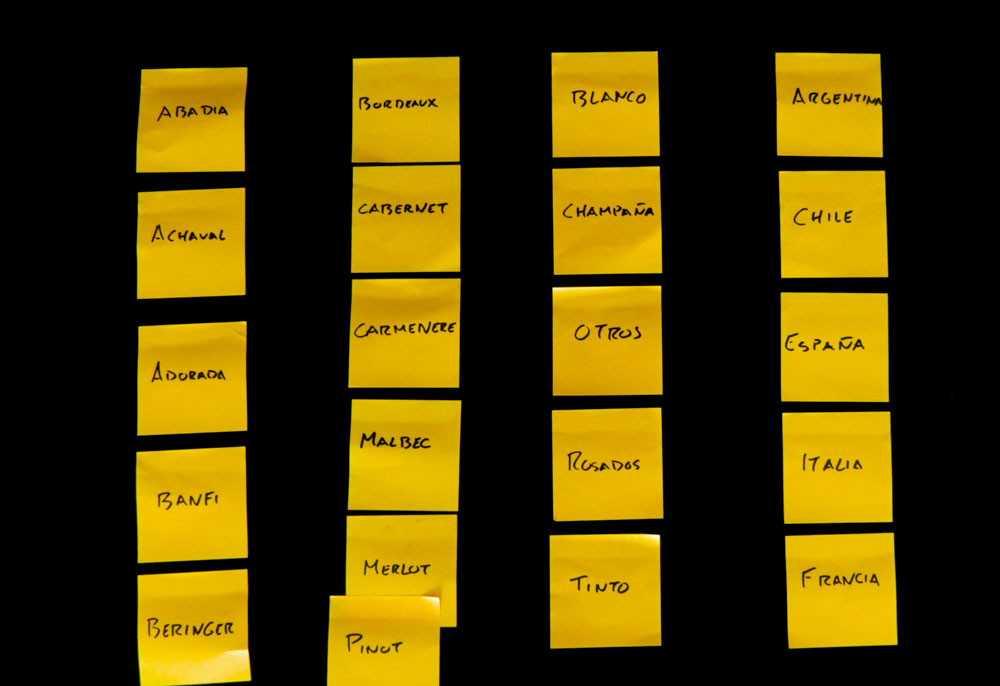
The topic or label for each group or list will start surfacing by it’s own accord, after grouping similar elements together. You can create different lists for different topics and then start naming or labeling each group.
Tree Structures
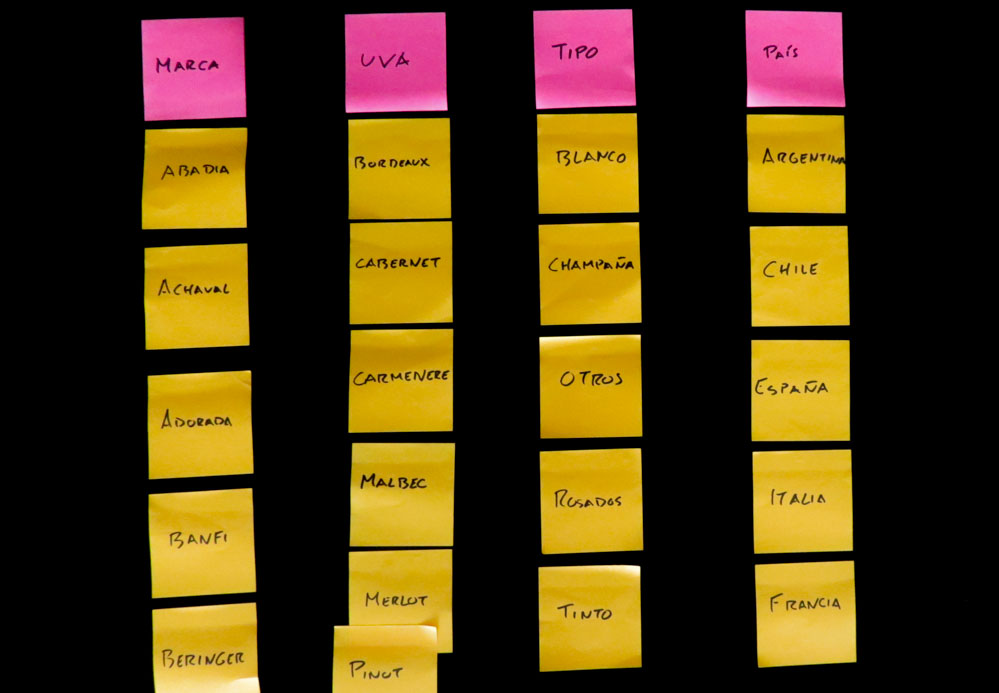
Moving on, we could work with two kinds of “Tree Structures” either a top-down or a bottom-up approach.
A top-down tree structure is what we are used to see in org charts or site maps. We could use them to organize different products into their own categories or taxonomies, structure the site’s content or finding out the reason behind a particular problem, asking they “5 times Why?” for each problem stated in each Post-It. It’s focused from the top down, because we have some sort of pre-understanding on how we can structure our data beforehand. The goal here is organizing the children into each parent category.
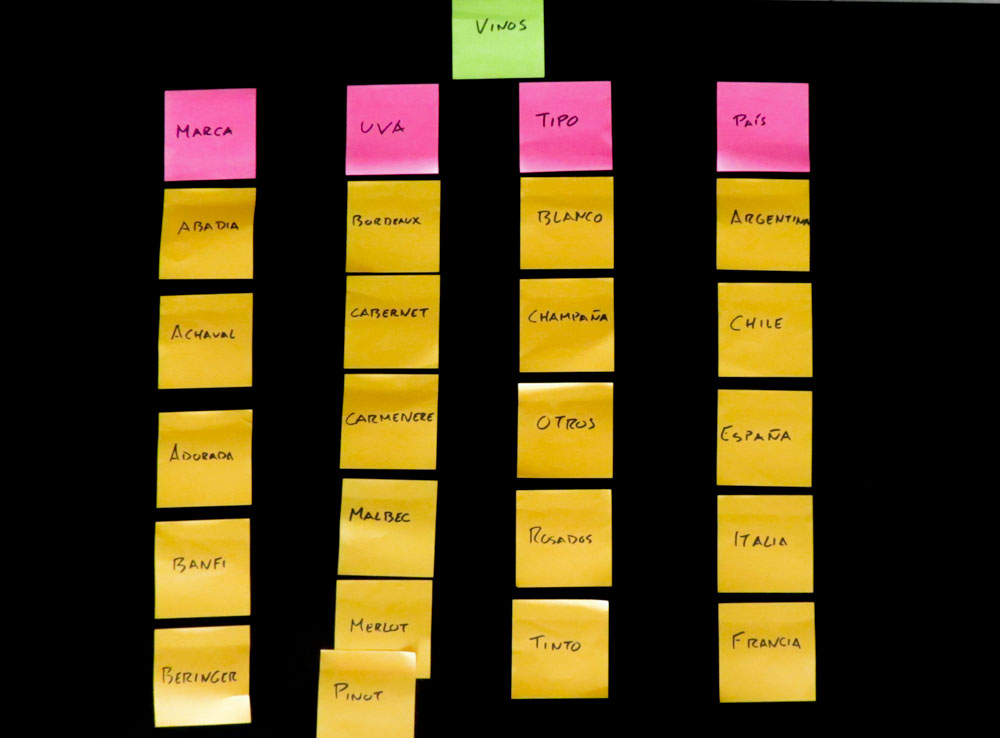
The bottom-up technique is more of a discovery process: you have the parts, and have founded some sort of relationship between some of them, but you’re not sure what they represent, or what is the cause of this symptoms. This is the procedure when working on an Affinity Map, you group all of your research findings and insights, and then you start to discover what they represent to the project.
Maps
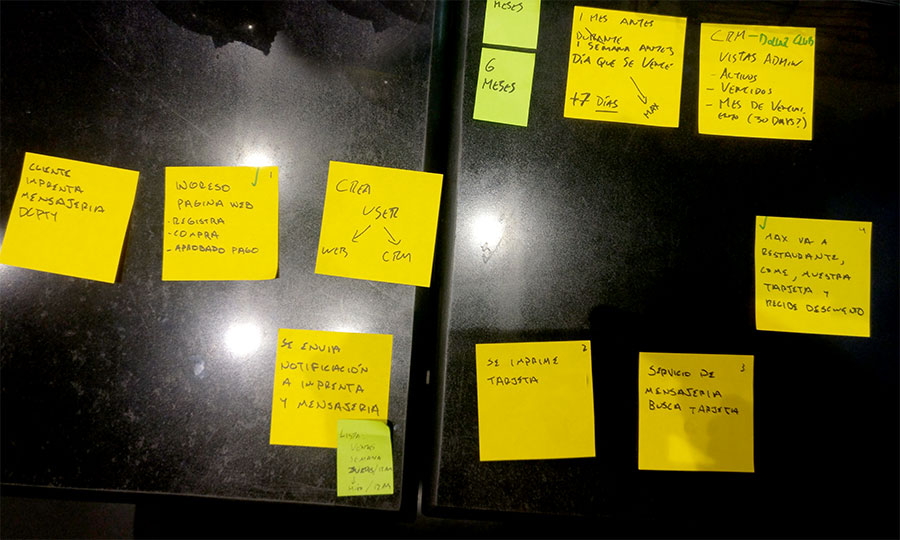
And one example of a map, would be the Action Map. It maps a process including all of it’s steps and actors that participate. It help us understand the steps or tasks we need to DO, to complete a process. Each step takes you to a following step or decision, just like a Flow Chart.
The straight forward way of creating an action map or flowchart, could be to list the individual actors on one side of the map, and then list the desired outcome on the other side of the board. Now, we have to figure out how to take each of the actors through a process that ends in our desired outcome, listing each of the steps in between.
The Action Map deeply resembles the Initial Experience Map taught in Google Design Sprint, where you map all the steps it takes to complete the task you are designing and testing in the Sprint.
Clean it up
After the mapping and card swapping exercise, you could then list everything in a computer, either in an Excel file, in individual lists or designed something more polished to present to the client:
Get the book.
If you are interested in perfecting your Post-It Notes game, I highly recommend the book “Rapid Problem Solving with Post-It Notes”, by David Straker. It’s the absolute resource on how to work with Post-Its, using different techniques, to find solutions to problems or situations you might be faced with, either in digital media in our case with UX, or business problems, etc. This book is more process oriented than theory, so you get a couple of “cooking recipes” to start working with Post Its in your organization right away. Go buy it.
In an era of digital products or apps specific for GTD, task management, project management and prototyping, writing things down in lists or Post-It Notes might not sound very sexy, but in fact might be the best and simpler way of collecting, organizing and processing data, to help you understand it’s meaning and enable you to propose a solution. Don’t underestimate the power of the Post-It, use it wisely, and use it often.

