
Customer Segments?
I’m sure you have participated in strategy meetings where customers segments are presented in demographic or geographic groups, or even classified by their lifestyles, logically organising the people we want to market into smaller niches. Customer segments are great because they give us a better idea of the market size, and are helpful to represent quantitative data, about the structure and distribution of said groups.
But how can we represent qualitative data obtained by researching these segments? Not every aspect of a person can be neatly unraveled into age, sex and location. Don’t get me wrong, I understand the importance of the data, but the methodologies we used to understand customers when we were selling cereal and detergent in the 50’s, might not be optimal for selling digital experiences today.
A better understanding of your customer segments
That’s why user research is so important: having the time to sit down and talk with our customers/users/leads to better understand them by observing them interact with our product first hand. [If you want to take a first glimpse on how to conduct a user interview, check out our previous post]
So, how can we have a better understanding of our customers, their behavior and attitudes so we can empathise with them? How do we visualise this data to share with our colleagues? If we go the “report route”, writing a 100+ page doc, it probably won’t be read by anyone and will be left in a drawer somewhere. It needs to be on point, accesible and in the face of anyone working on the project, so every team member remembers and consider the user into his decisions.
Let’s take a look at a couple of mapping methods from different disciplines, that can help us visualize our segments and get us on track with our decision making. All these are collaborative tools, that will get the conversation started within our teams:
- Empathy Maps, from design thinking
- Story Cards, from agile project management
- User Personas, from user experience design
Empathy Maps
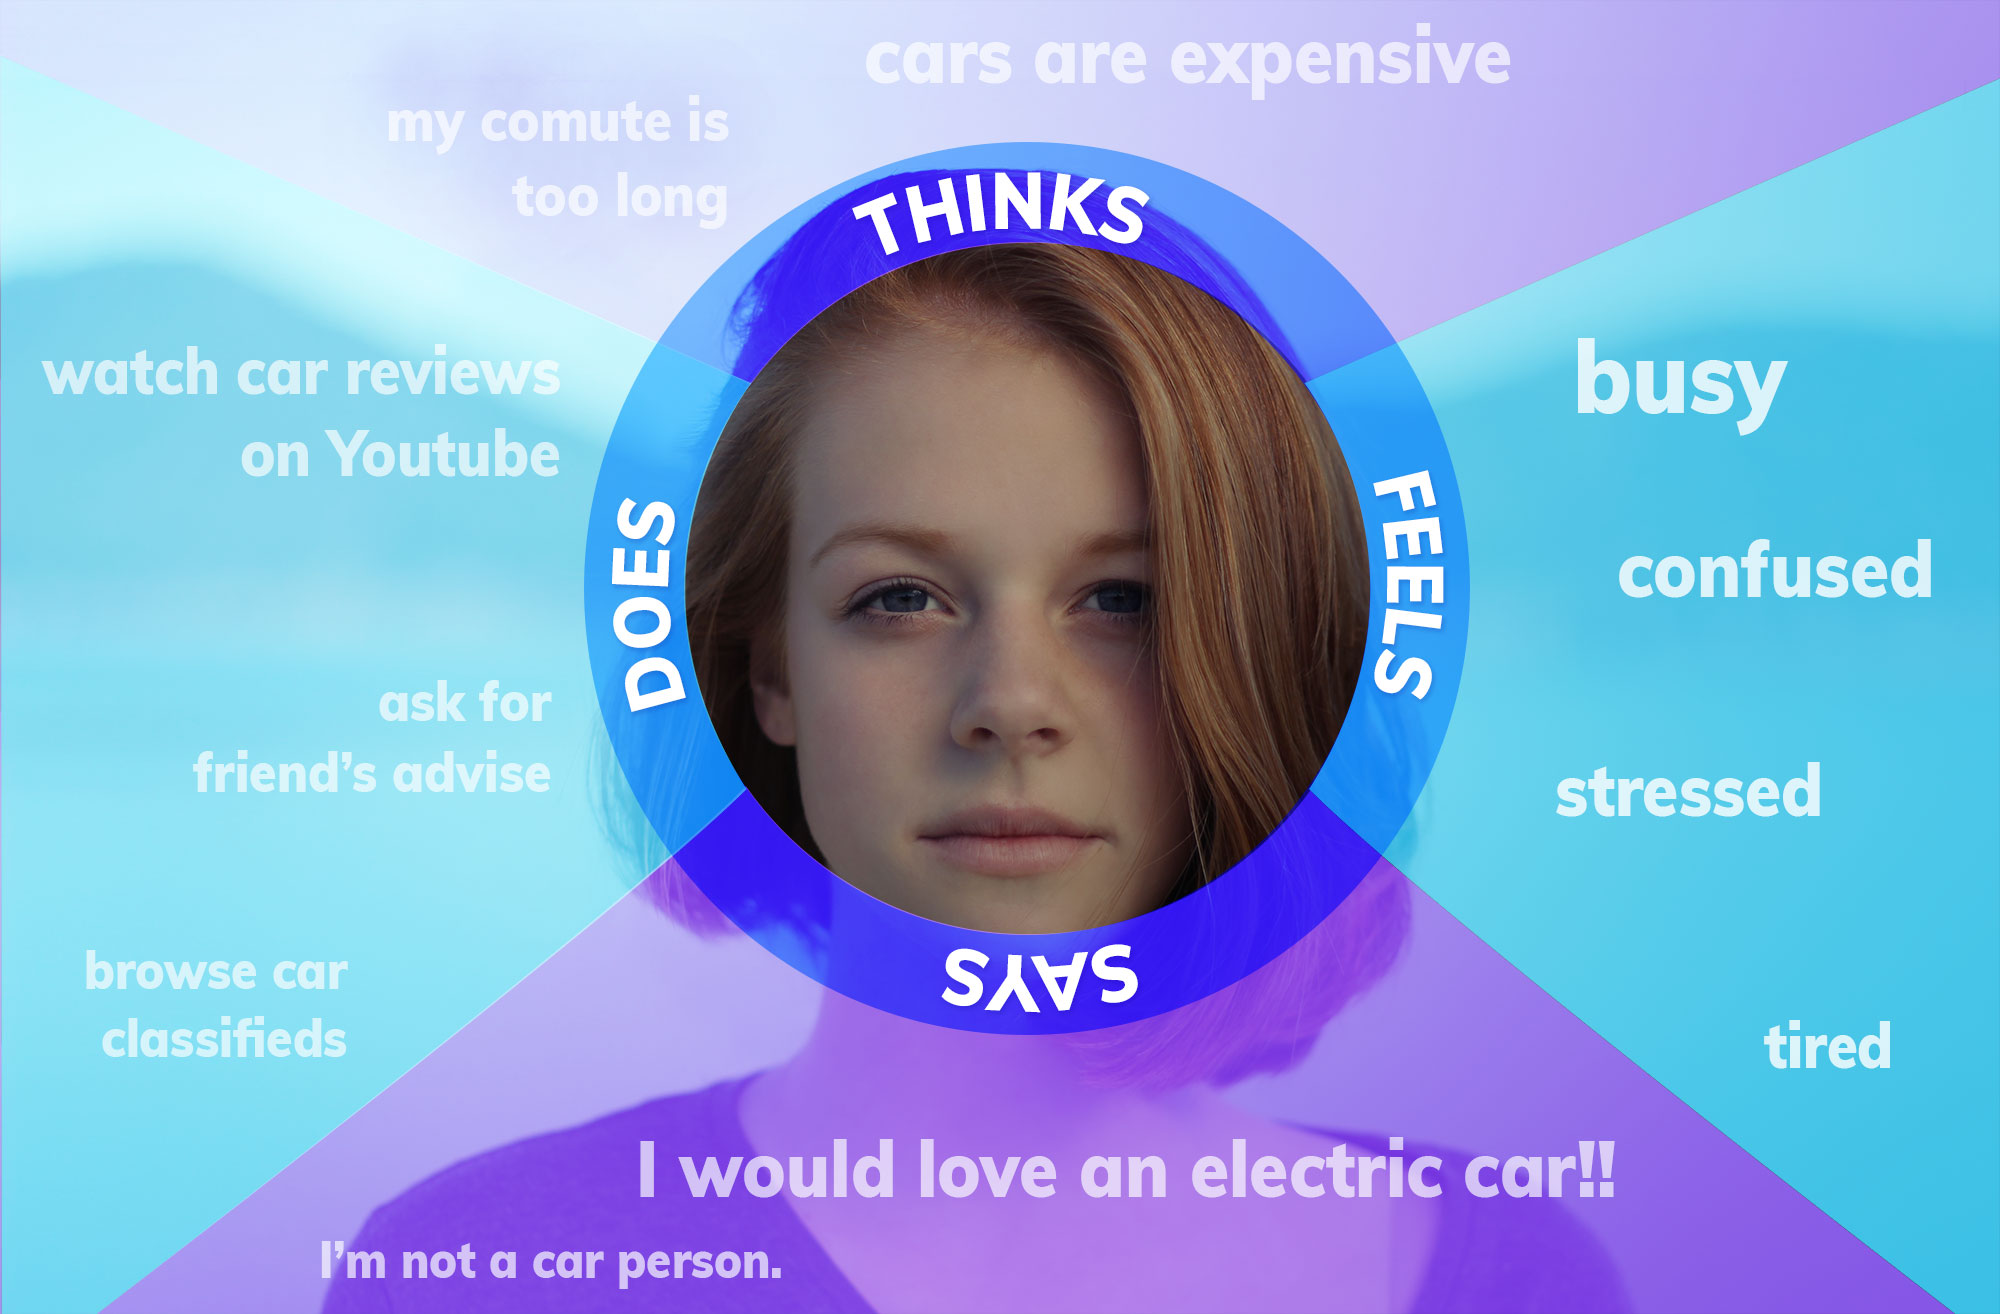
Empathy maps let us understand what our segments are thinking and feeling when they are using our products; what drives their actions. They illustrate these insights into four quadrants:
- Says: it’s what the user literally said in the interview, quotes or comments regarding key aspects of our product or the problem we’re trying to solve.
- Thinks: what he might be thinking throughout the interview or user test, what matters to him and might not be ready to express.
- Does: what he really does during the interview, physically, related to the product.
- Feels: what is exciting, intimidating or worrying for him; his emotional state.
- Pains: what problems or pains the user might be experiencing?
- Goals: what is his ultimate goal? What do they want to achieve?
Sometimes people fill out these diagrams with what they think their users say, think and do; or are not sure what to put in one of these quadrants. This is not as beneficial and might be an indicator that you should go out and do more research. You won’t get any insights if you fill out this diagram with only your assumptions.
Remember that the goal with this diagram is to empathise with the user, put yourself into his shoes and uncover what are his motivations, needs and pains. This part is key to designing successful user experiences.
Story Cards
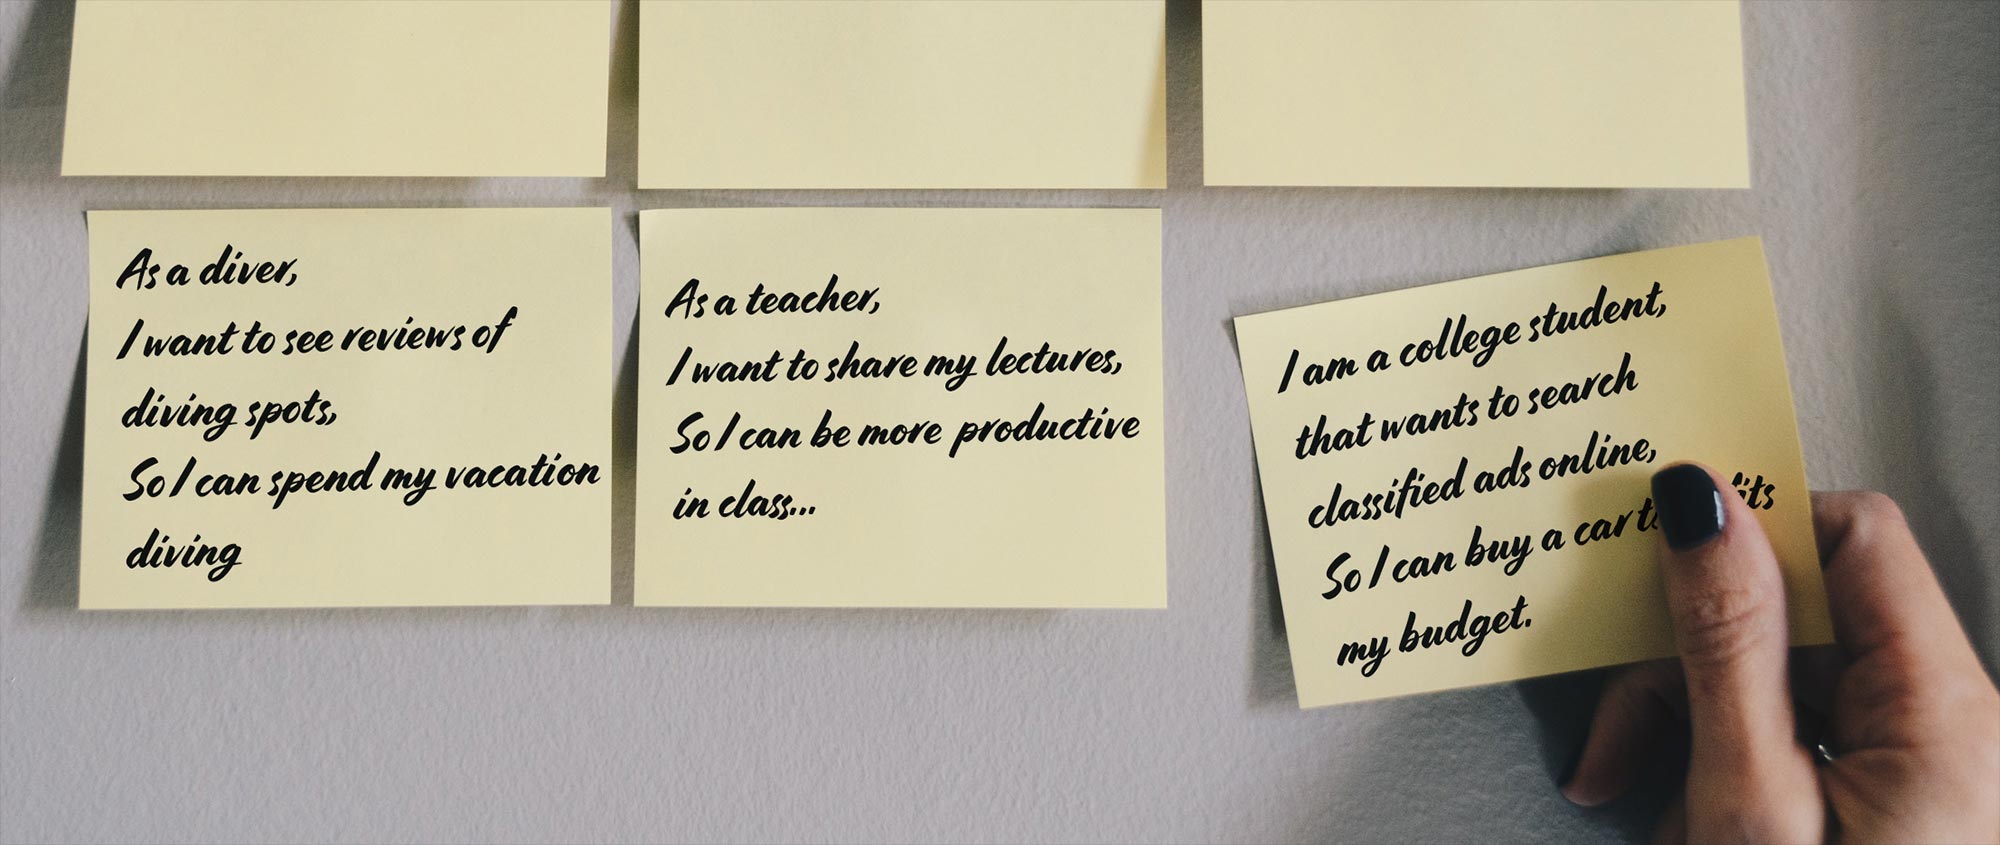
Story Cards are a tool that allow us to capture requirements for our products, from the point of view of our uses. They tie up who the user is, what he wants to accomplish and why… so the software requirement is not divorced from the user’s needs. They have 3 lines:
- As a ROLE,
- I want to TASK,
- So that GOAL.
Following this mini-script, we can reframe a list of features stakeholder think they need in their products, into a list of actual task a real user needs to execute to accomplish a goal. For example:
- I am a college student,
- that wants to search classified ads online,
- So I can buy a car that fits my budget.
One of the main benefits from this is realizing that if you can’t write a user story explaining what the user needs to accomplish, must likely you won’t need that specific feature in your app. The other aspect is that it pushes you to frame the problem, allowing the design or development team to look for the best solution for it… instead of asking for a specific software feature.
In this particular case, User Stories describe what the user wants to accomplish, instead of describing particular aspects of his person or personality (like in empathy maps or user personas); they are also very focused and a lot shorter. But, it’s a great way to focus the conversation in our users.
User Personas
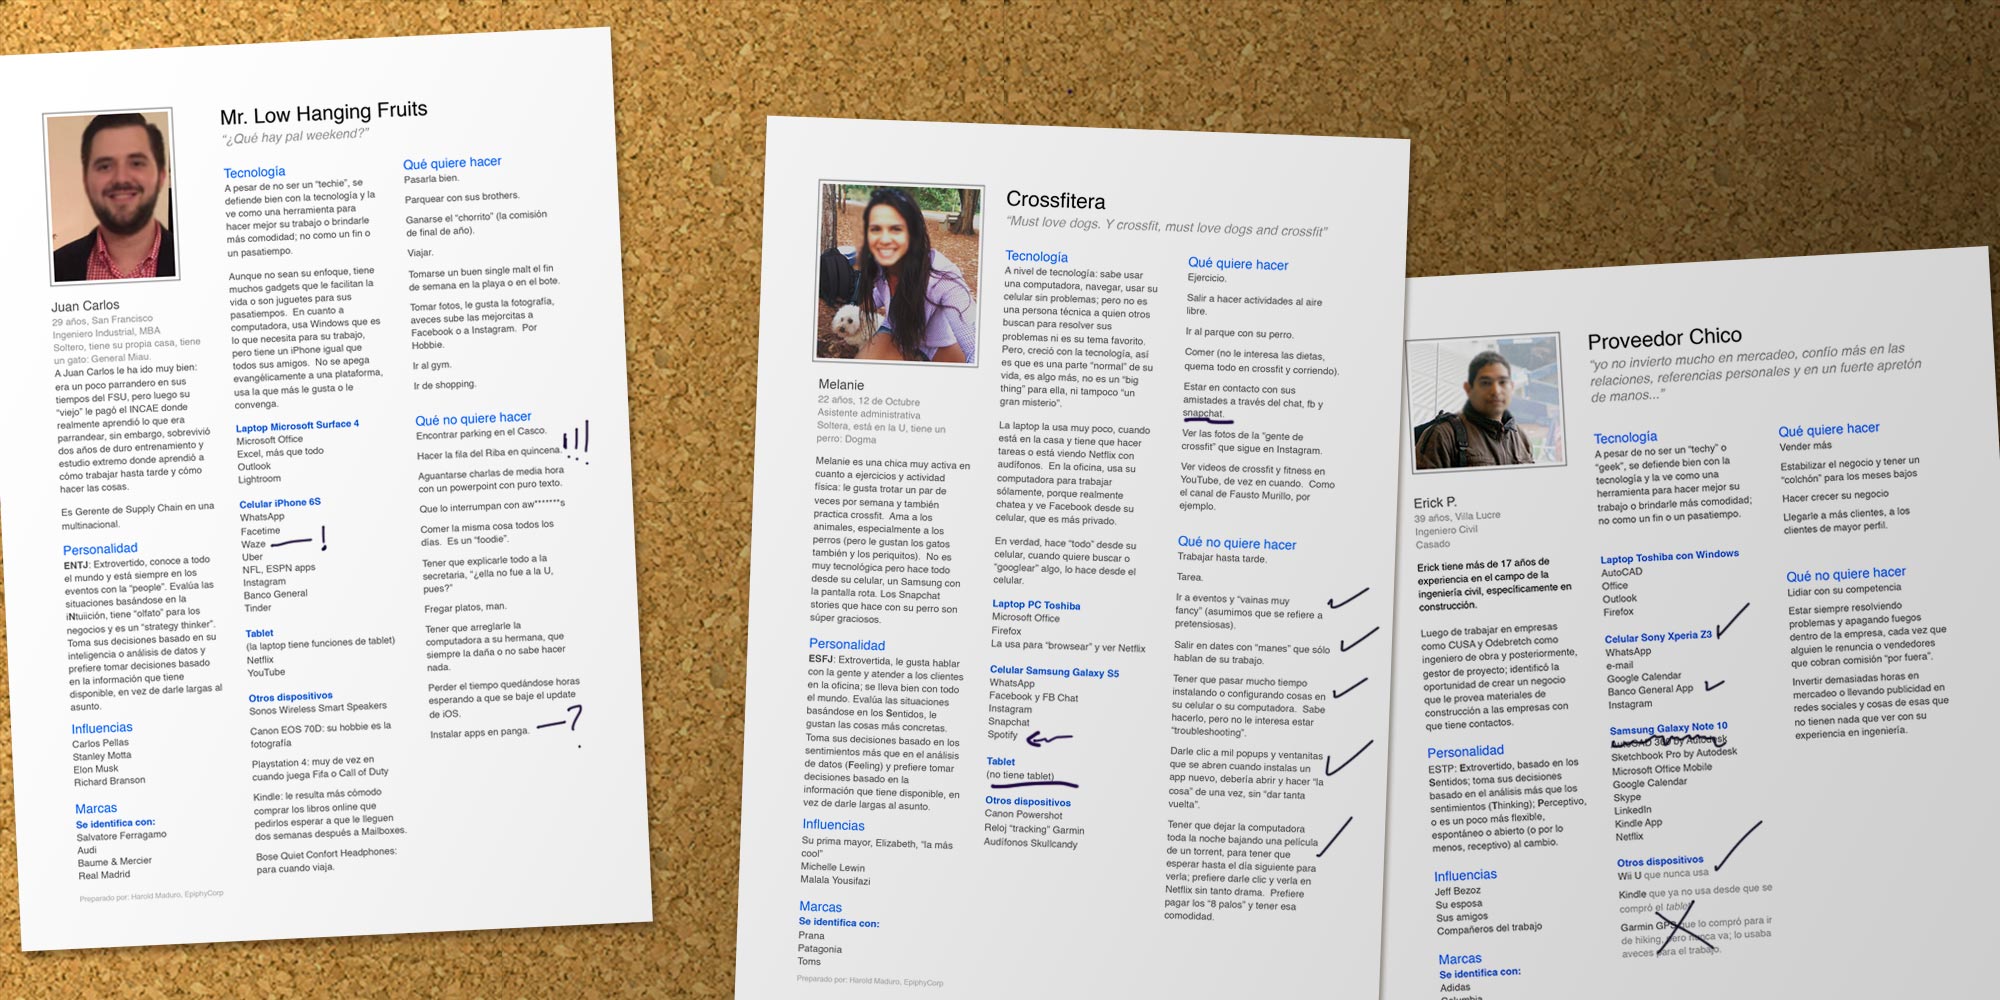
A persona is a representation of a subset of your target audience who shares behaviours, motivation and goals about your product. A persona is a fictional character, complete with a name and a photo, that details his behavior and how he uses our or similar products. As the rest of the mapping tools discussed, we use them to help us get a deeper understanding of our users.
User personas humanize data and turn research results into story telling. It might be difficult for someone to relate to a specific demographic, but easier to remember and relate to information told into a story.
So, depending on how much detail you might want to represent, you can add some background information about the person, what kind of education and career he has or where he lives. You could also describe his behavior related to your product: if it’s a digital product, what kind of smartphone he owns, what are his favorite apps, etc.
In some cases, we might want to generally describe his personality. I have found the Myers-Briggs archetypes a simple framework to follow. Remember, it’s not a psychological profile you want to present, but a visualitzation that will give your stakeholders a general feeling on who this person is, how he works and how he interacts with your product.
“However, when you do the field studies, you create relationships with the people in your research. You can return to those people and ask them questions.
You can learn about the things they do. The persona becomes a package for containing what you’ve learned from your field research. A package that is transportable to everyone on the team, so they can have the same benefits of knowing the users as you have.”
A map for each test subject or aggregate?
We could certainly create one map to represent each person we interview, specially if we only talk to a couple of users; but we can benefit from this tool by using one map to represent aggregated data from persons with similar behaviors. So we end up with one map per each group of people who have been interviewed in several sessions and who share similarities that are relevant to our product.
You should start today!
One takeaway is that these visualisations don’t need to be designed or presented in high fidelity; on the contrary, if you want to push your teams to incorporate them into their process, they can be very informal, like using Post-it Notes on a whiteboard and discussing them in a stand up meeting.
Another benefit of personas or empathy maps is that they help focus your design team into designing for the right people, instead of designing based on assumptions or designing for themselves. And of course, also informing the development team once coding starts and guiding them to continually apply the information that was collected doing research into the product as it’s being developed.
The important thing is that these maps (personas, empathy maps or story cards) need to be accesible to everybody working on the project. And that might be the primary benefit of using them: it forces the conversation between team members and stakeholders, helping align everybody inside the project towards a shared goal and hopefully allowing us to create a more user centered product.